Kubernetes Report
3 minute read
Kubernetes Report displays aggregated and granular cost data for your clusters, namespaces, workloads, and labels, allowing you to:
- View cost trends over time.
- Filter and refine data groupings.
- Drill down to resource-level cost details.
- Analyze CPU, memory, and shared costs across environments.
Kubernetes cost allocation is based on effective cost (after discounts), or on list cost for tenants configured to view undiscounted costs only. See How costs are allocated for how idle and overhead capacity is handled.
Kubernetes Report requires a connected cloud provider and cost metrics enabled on your clusters. See Set up Kubernetes cost allocation.
Customizations made in the Kubernetes Report view do not persist when you leave the page.
Access Kubernetes Report
-
Log in to the CloudBolt Platform.
-
In the sidebar, select Kubernetes Report.
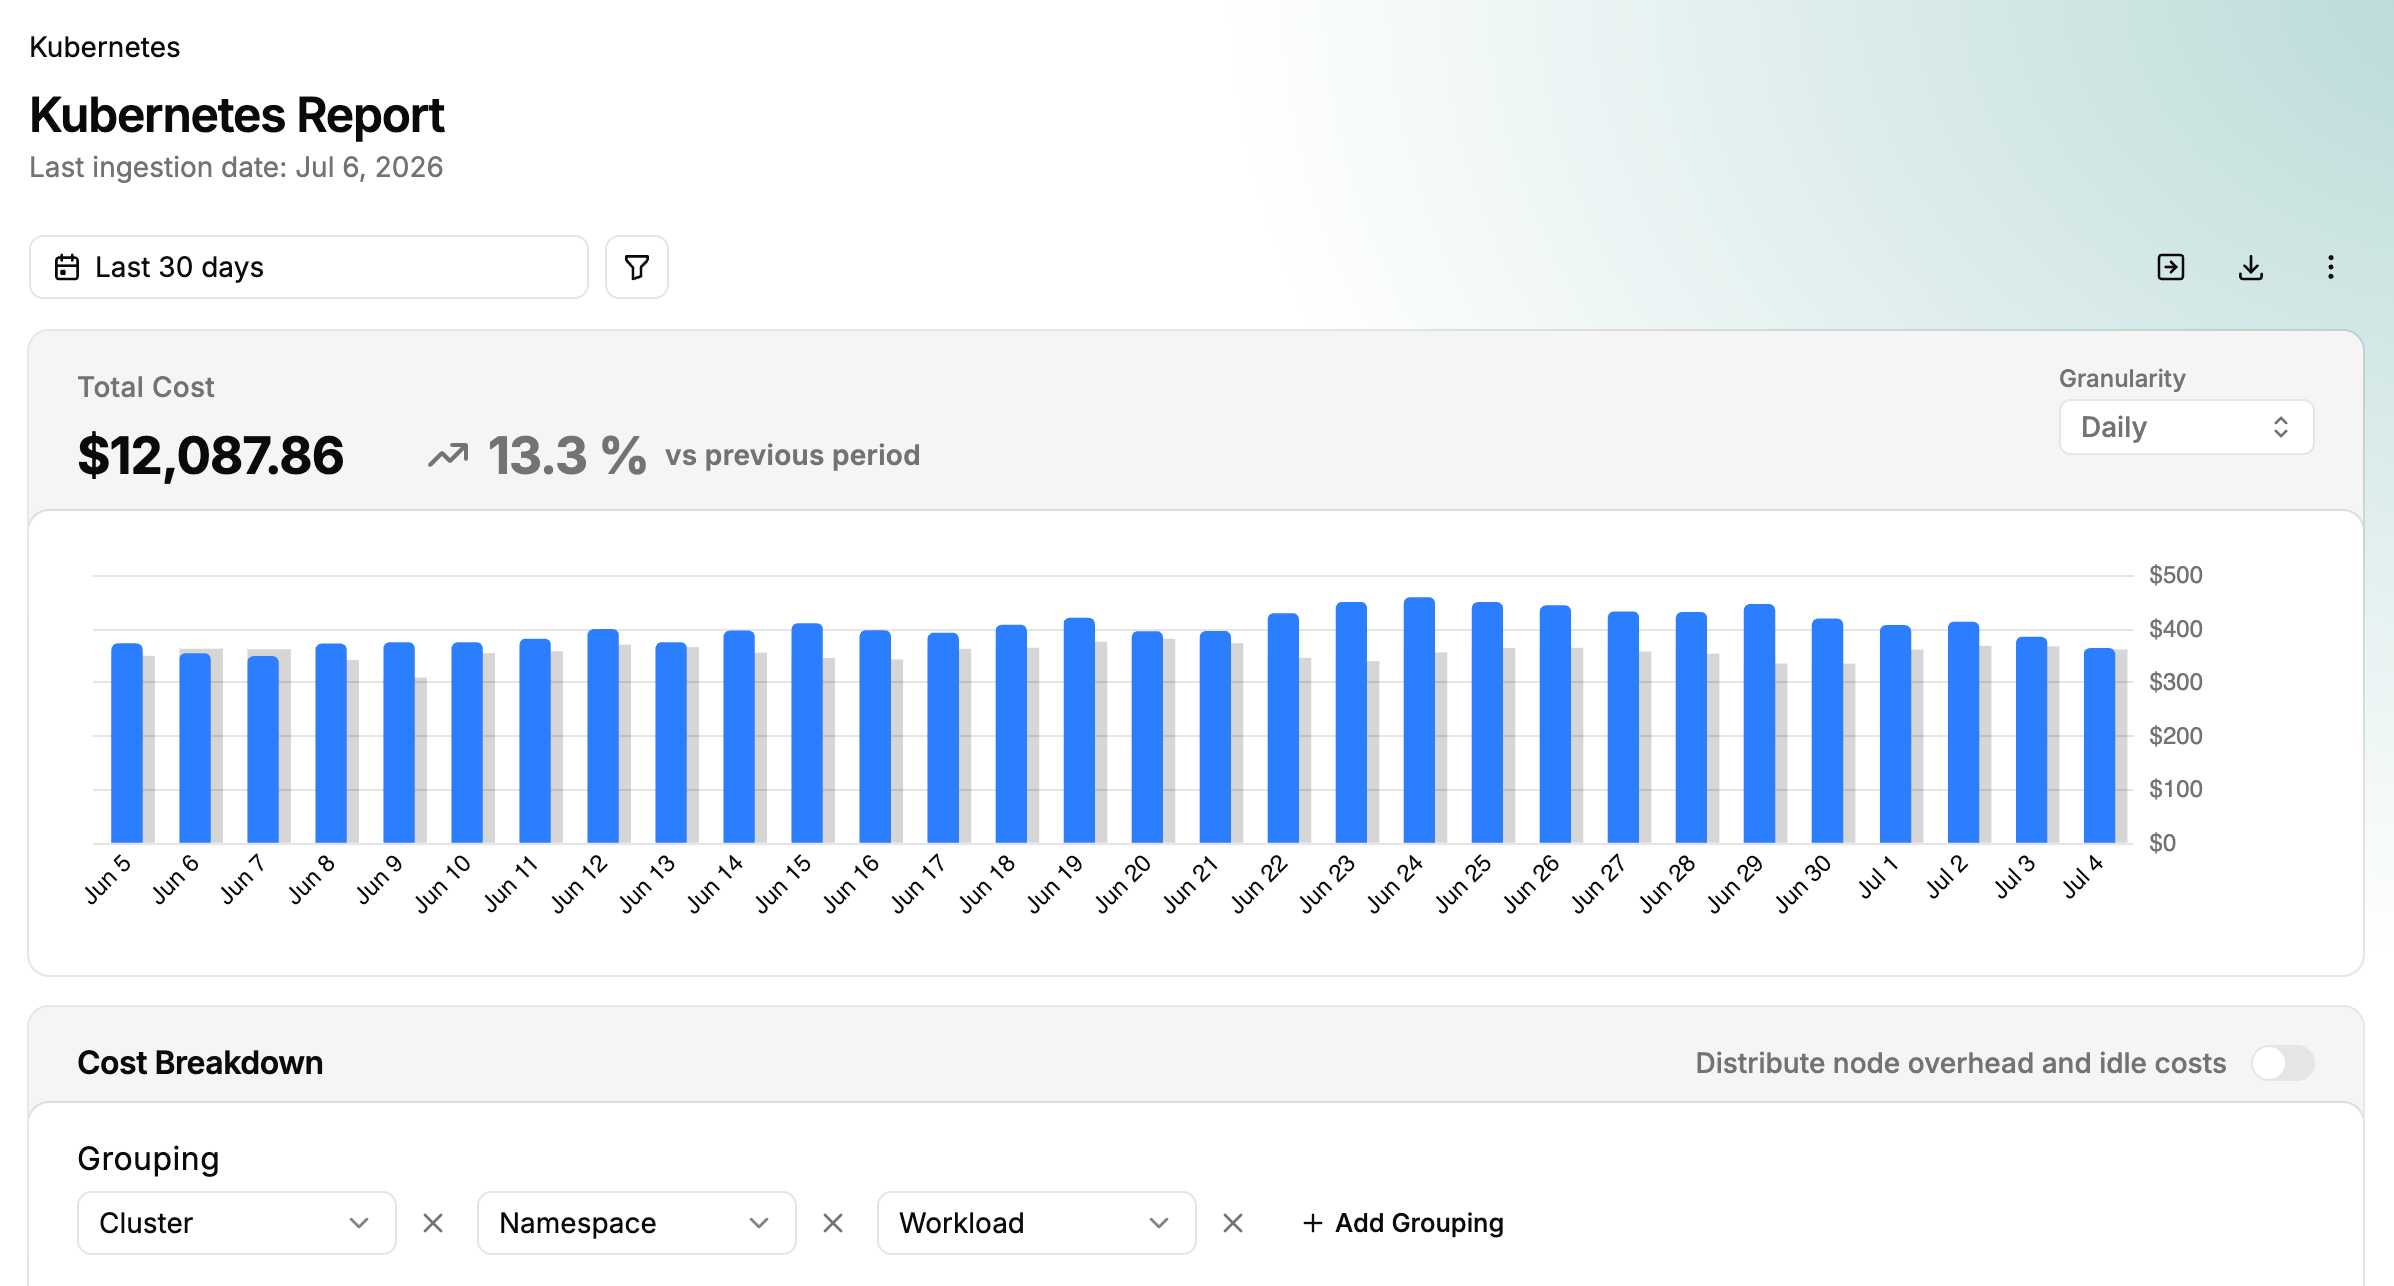
Kubernetes Report overview
The default view displays daily spending for all clusters over the past 30 days and includes:
Total Cost
- Displays total daily or monthly cost across all clusters in the selected date range.
- Hover over each bar to view the total cost per day or month.
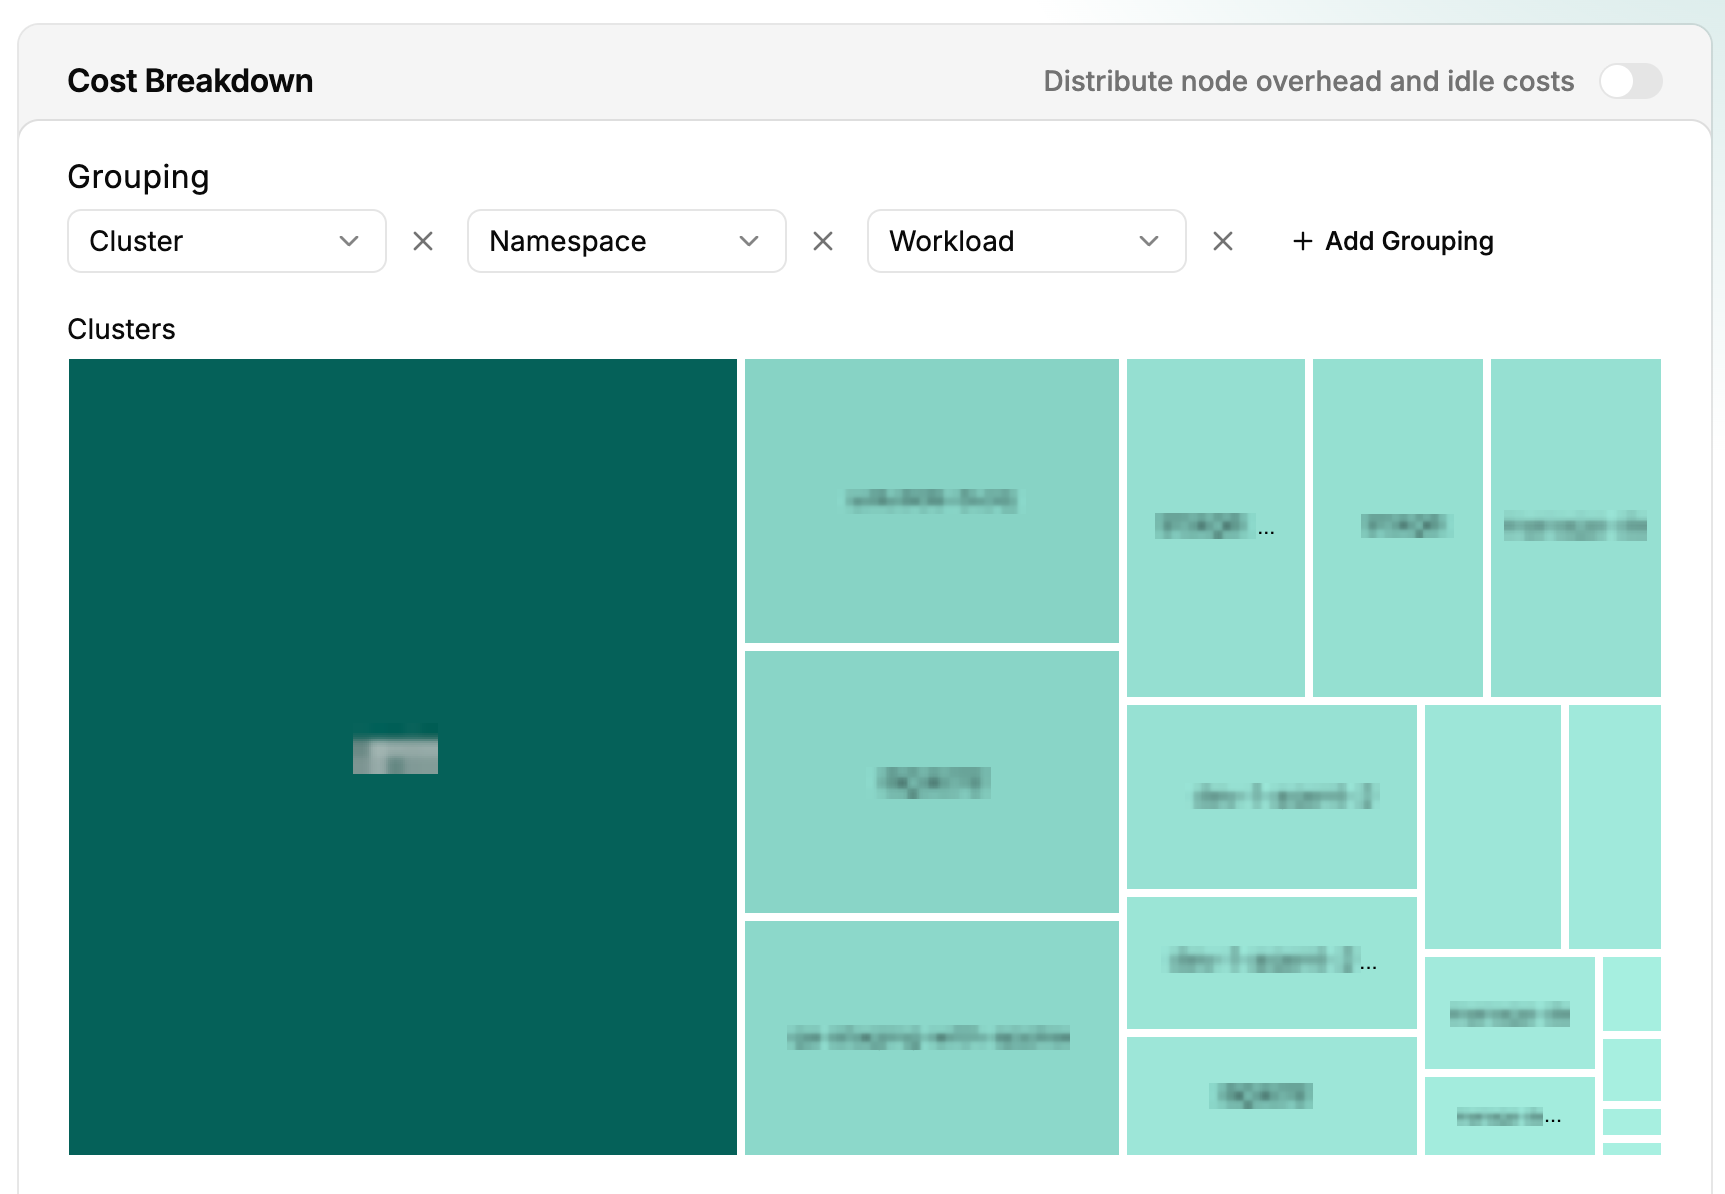
Cost Breakdown
- Visualizes cost distribution in an interactive treemap and table view.
- Hover over a segment to view CPU, RAM, and shared costs.
- Select a segment to drill down into detailed (for example, namespace and workload) costs.
- Review detailed cost breakdown information in the table below the treemap.
 (opens full-size image in a new tab)
Working with the data
You can interact with the data to refine your analysis:
-
Change the date range: Use the date selector above the chart to update the displayed date range, or choose a preset option such as Last Month.
-
Filter by cluster, namespace, container, and more: Use the filter options above the chart to limit displayed data.
-
Adjust granularity: Toggle between daily and monthly cost views, helpful when analyzing longer date ranges.
-
Customize grouping: Update and extend the group-by configuration to refine aggregation in the cost breakdown card. Group by cluster, namespace, workload, container, pod, node, or a Kubernetes label.
-
Drill down: Select segments or table rows to explore deeper levels of cost attribution.
-
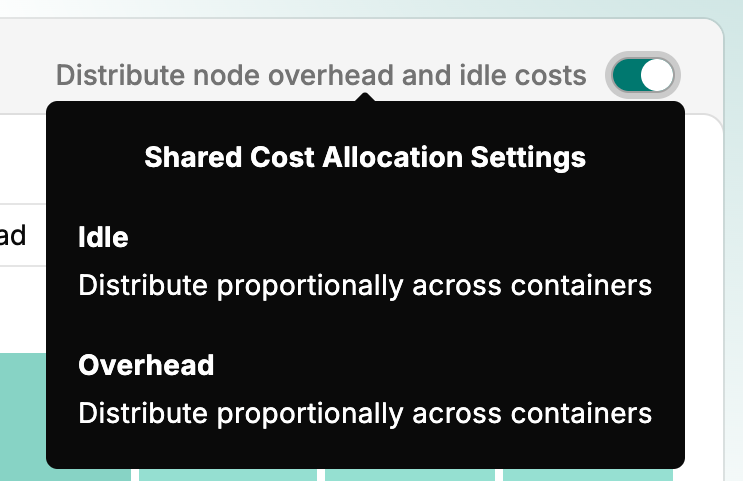
Allocate shared costs: Expand the Cost Allocation filter section and turn on Distribute idle & overhead costs to spread idle and overhead capacity across your workloads instead of showing it separately.
-
View in Cost Explorer: Select View in Cost Explorer to open the current data in Cost Explorer, carrying over your active filters. Cost Explorer’s Kubernetes cost allocation data set offers the same grouping, filtering, and allocation options; see Cost Explorer.
How costs are allocated
Kubernetes billing data separates workload costs from the capacity your cluster paid for but didn’t hand to a workload: idle capacity, and overhead such as system pods. By default, IDLE and OVERHEAD appear as their own line items alongside your real namespaces, so you can see unused capacity as a distinct cost.
Turning on Distribute idle & overhead costs (in the Cost Allocation filter section) spreads those idle and overhead costs across your workload namespaces instead, proportional to their usage. This changes how costs are attributed, not the total. The same spend is shown either as its own line or folded into the workloads that share the cluster.
Costs can be grouped or filtered by:
- Cluster, Namespace, Workload, Container, Pod, and Node
- Kubernetes labels applied at the namespace or pod level (for example,
Namespace Label: team)
Kubernetes cost data reflects your cloud provider’s tags at the time of ingestion. Virtual tags created in CloudBolt do not currently apply to Kubernetes cost data.