Cost Explorer
14 minute read
The Cost Explorer displays aggregated cost data across cloud providers, helping you understand where spending occurs and how it changes over time.
Cost Explorer automatically loads the latest preset report, a standardized view of your organization’s cloud provider cost data. From here, you can experiment with customizing the report.
The preset report is a starting point for cost analysis, and changes to it can’t be saved directly. You can create a custom report by selecting Save As after customizing the cost report criteria.
Access the Cost Explorer
To open the Cost Explorer:
- Go to Cost Explorer.
Preset report overview
The preset report is a read-only, system-generated report provided as a starting point for cloud provider cost analysis. It demonstrates the available cost-reporting capabilities and provides a baseline structure for new reports.
It includes:
- Total cost over the time range
- Spend by cloud provider and service
- Cost trends
The preset report cannot be edited directly. New cost reports use this template. Configure a cost report to meet your organization’s needs, then select Save As to create a customized report.
Working with the preset report
Interact with the preset report to explore the data:
- Adjust the data set, group by, metric, date range, and filter settings in the cost report criteria panel.
- Expand sections in the Cost Data Details table for detailed analysis.
Any changes made to the preset report update only the current view.
Preserve a customized version by selecting Save As in the cost report criteria panel. This creates a new saved report under Saved Reports.
Cost Explorer chart
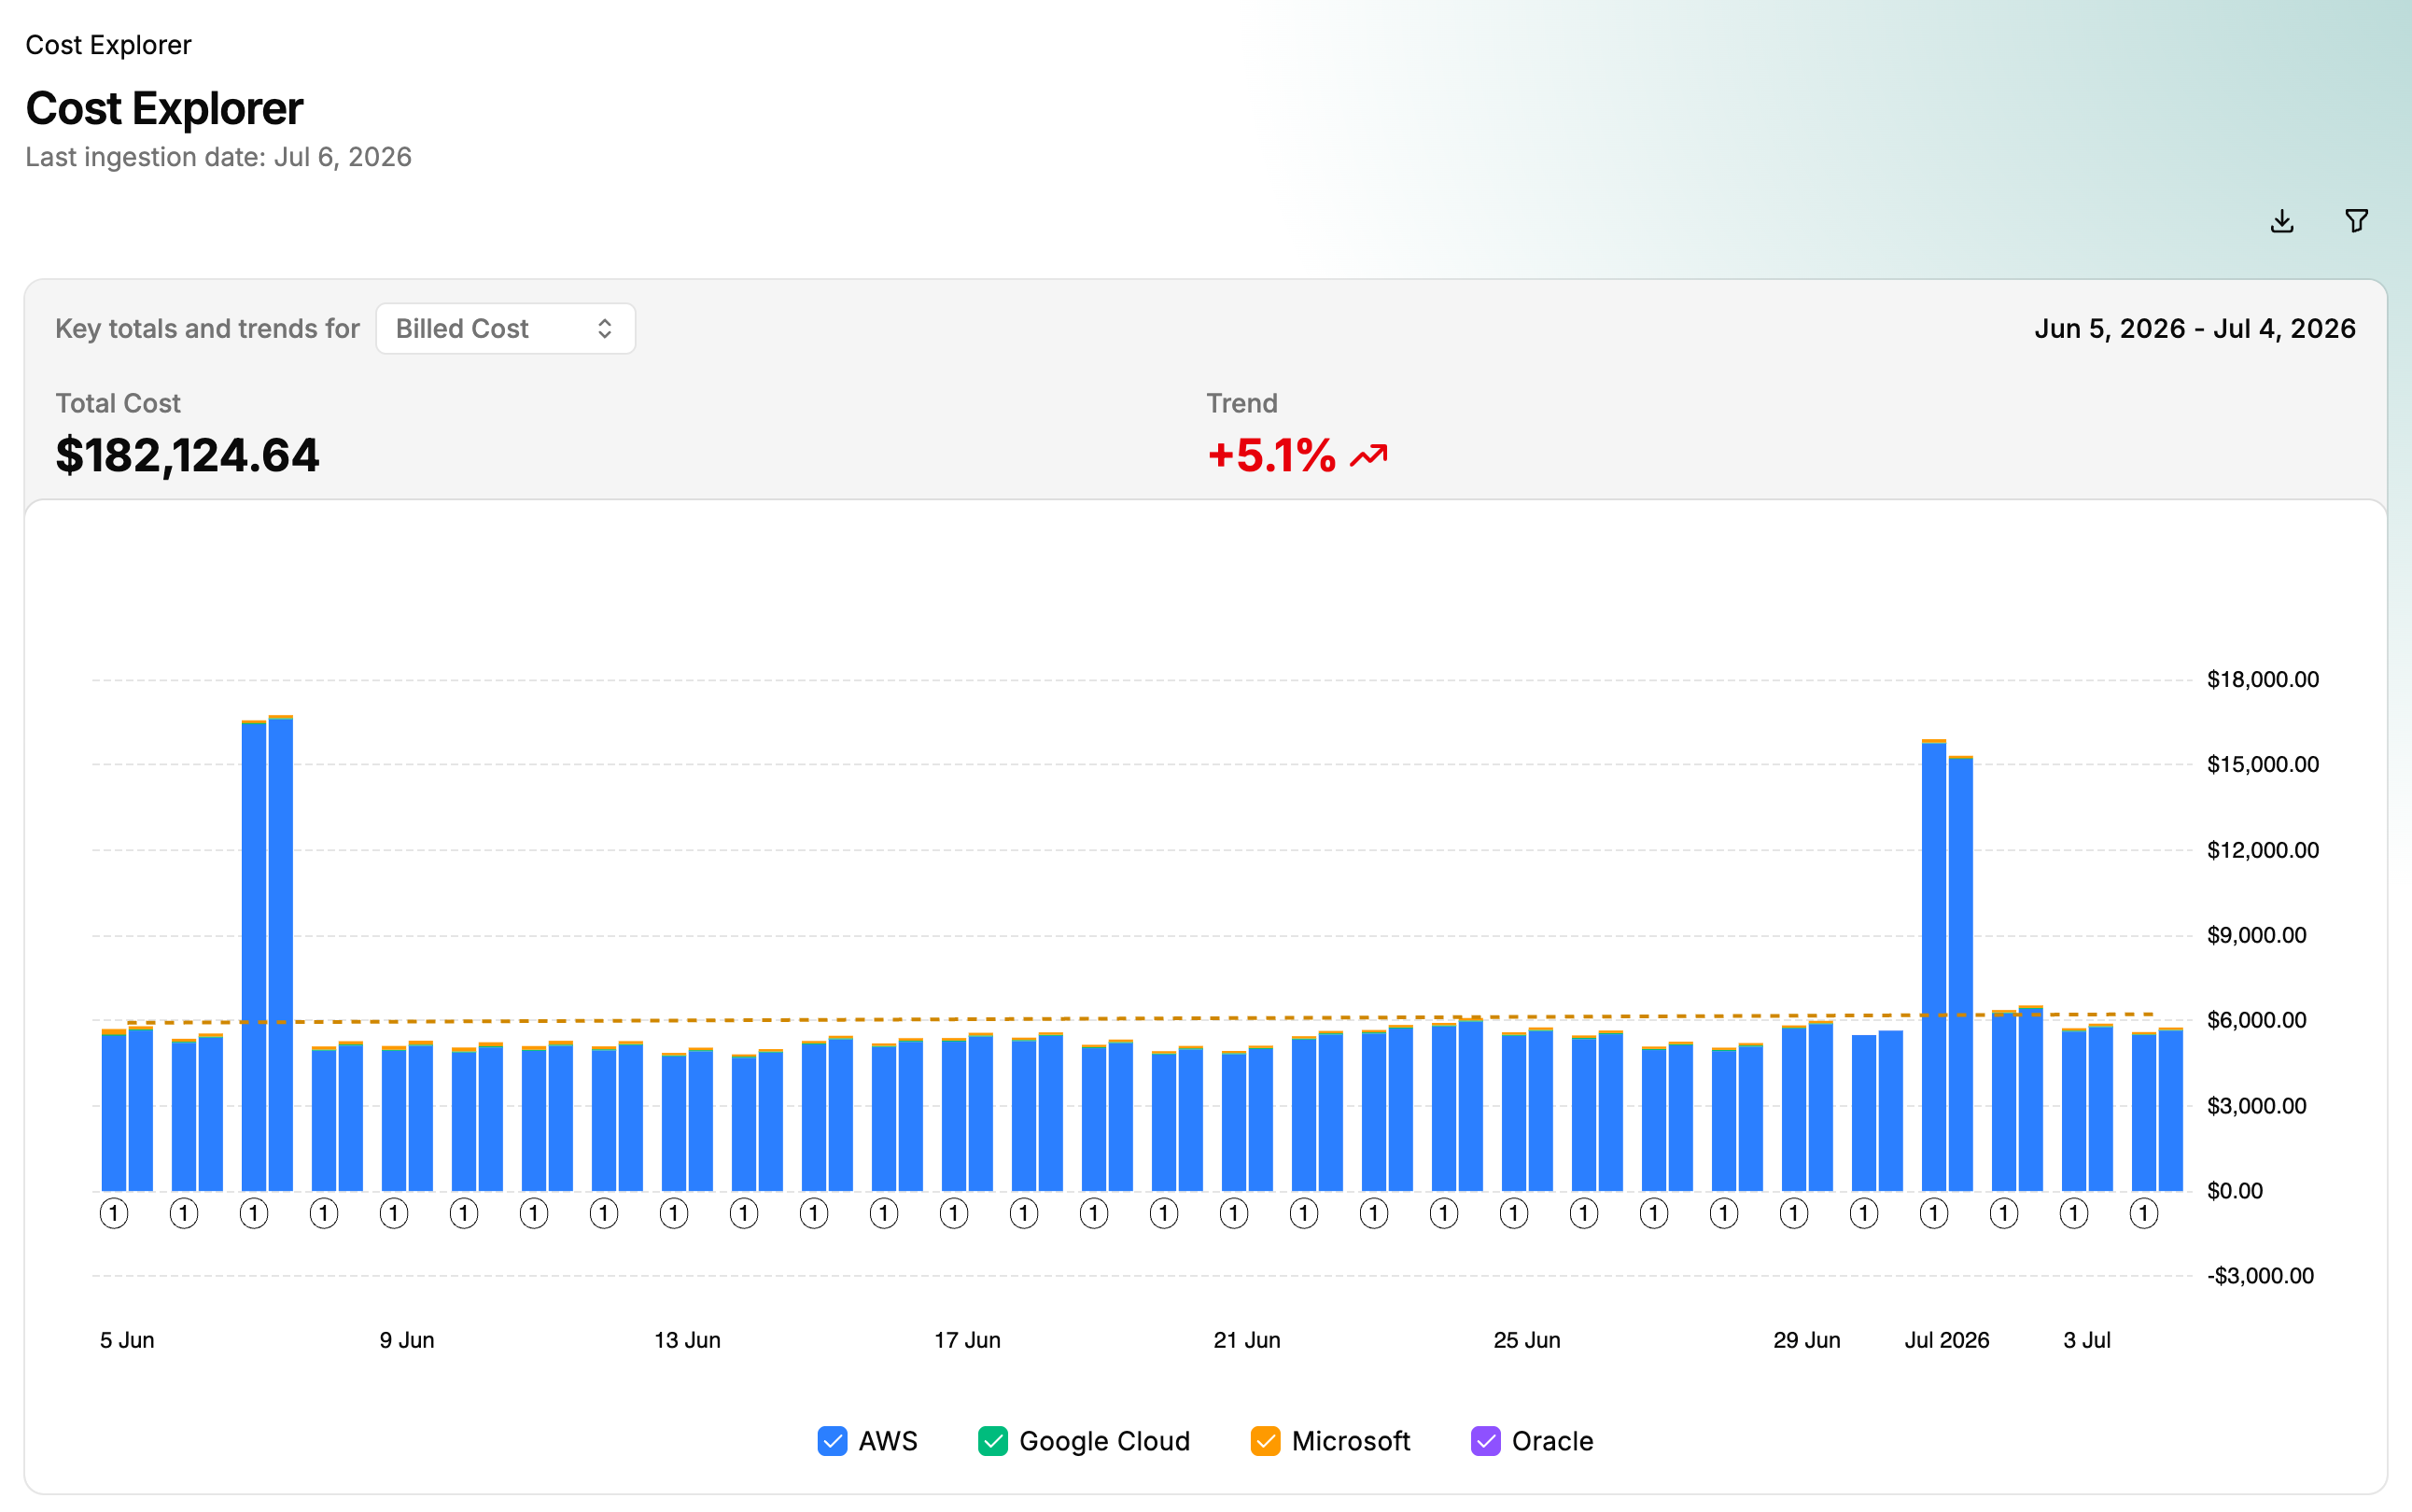 (opens full-size image in a new tab)
| Field | Description |
|---|---|
| Cost Metric | The metric used for the total cost and trend. |
| Total Cost | Total cost for the date range and cost metric. |
| Cost Bars | Cost and metric for a day, week, or month, showing temporal variation. Stacked by the primary “group by” setting. Hover for more detail. |
| Cost Metric Labels | Numbered labels for metrics corresponding to the hover details. |
| Date Granularity | Displays daily dates, week start, or month start. |
| Primary “Group By” | Color-coded primary “group by” setting. |
| Trend Line | Cost trend over the time range. |
| Trend Percentage | Percentage change in the cost metric relative to the start date. |
| Export report | Toolbar icon (hover to see its label). Opens the export menu. Download the report as PDF, PowerPoint (.pptx), Excel (.xlsx), CSV, or JSON. |
| Show filters / Hide filters | Toolbar icon (hover to see its label). Opens the cost report criteria panel. |
Amounts are shown in the currency selected under Currency in the account menu. If Source currency is selected and the report is not in USD, a bar above the chart states the currency basis (for example, Showing source currency (EUR) or Source currency unknown) or notes that the report contains mixed currencies. If an amount can’t be converted to the selected currency, it is shown in its source currency, and a warning appears above the chart.
Cost Data Details table
Sort the cost data by selecting any column header. Sorting applies to numerical (Billed Cost, Effective Cost) and categorical (Provider Name, Service Category) values.
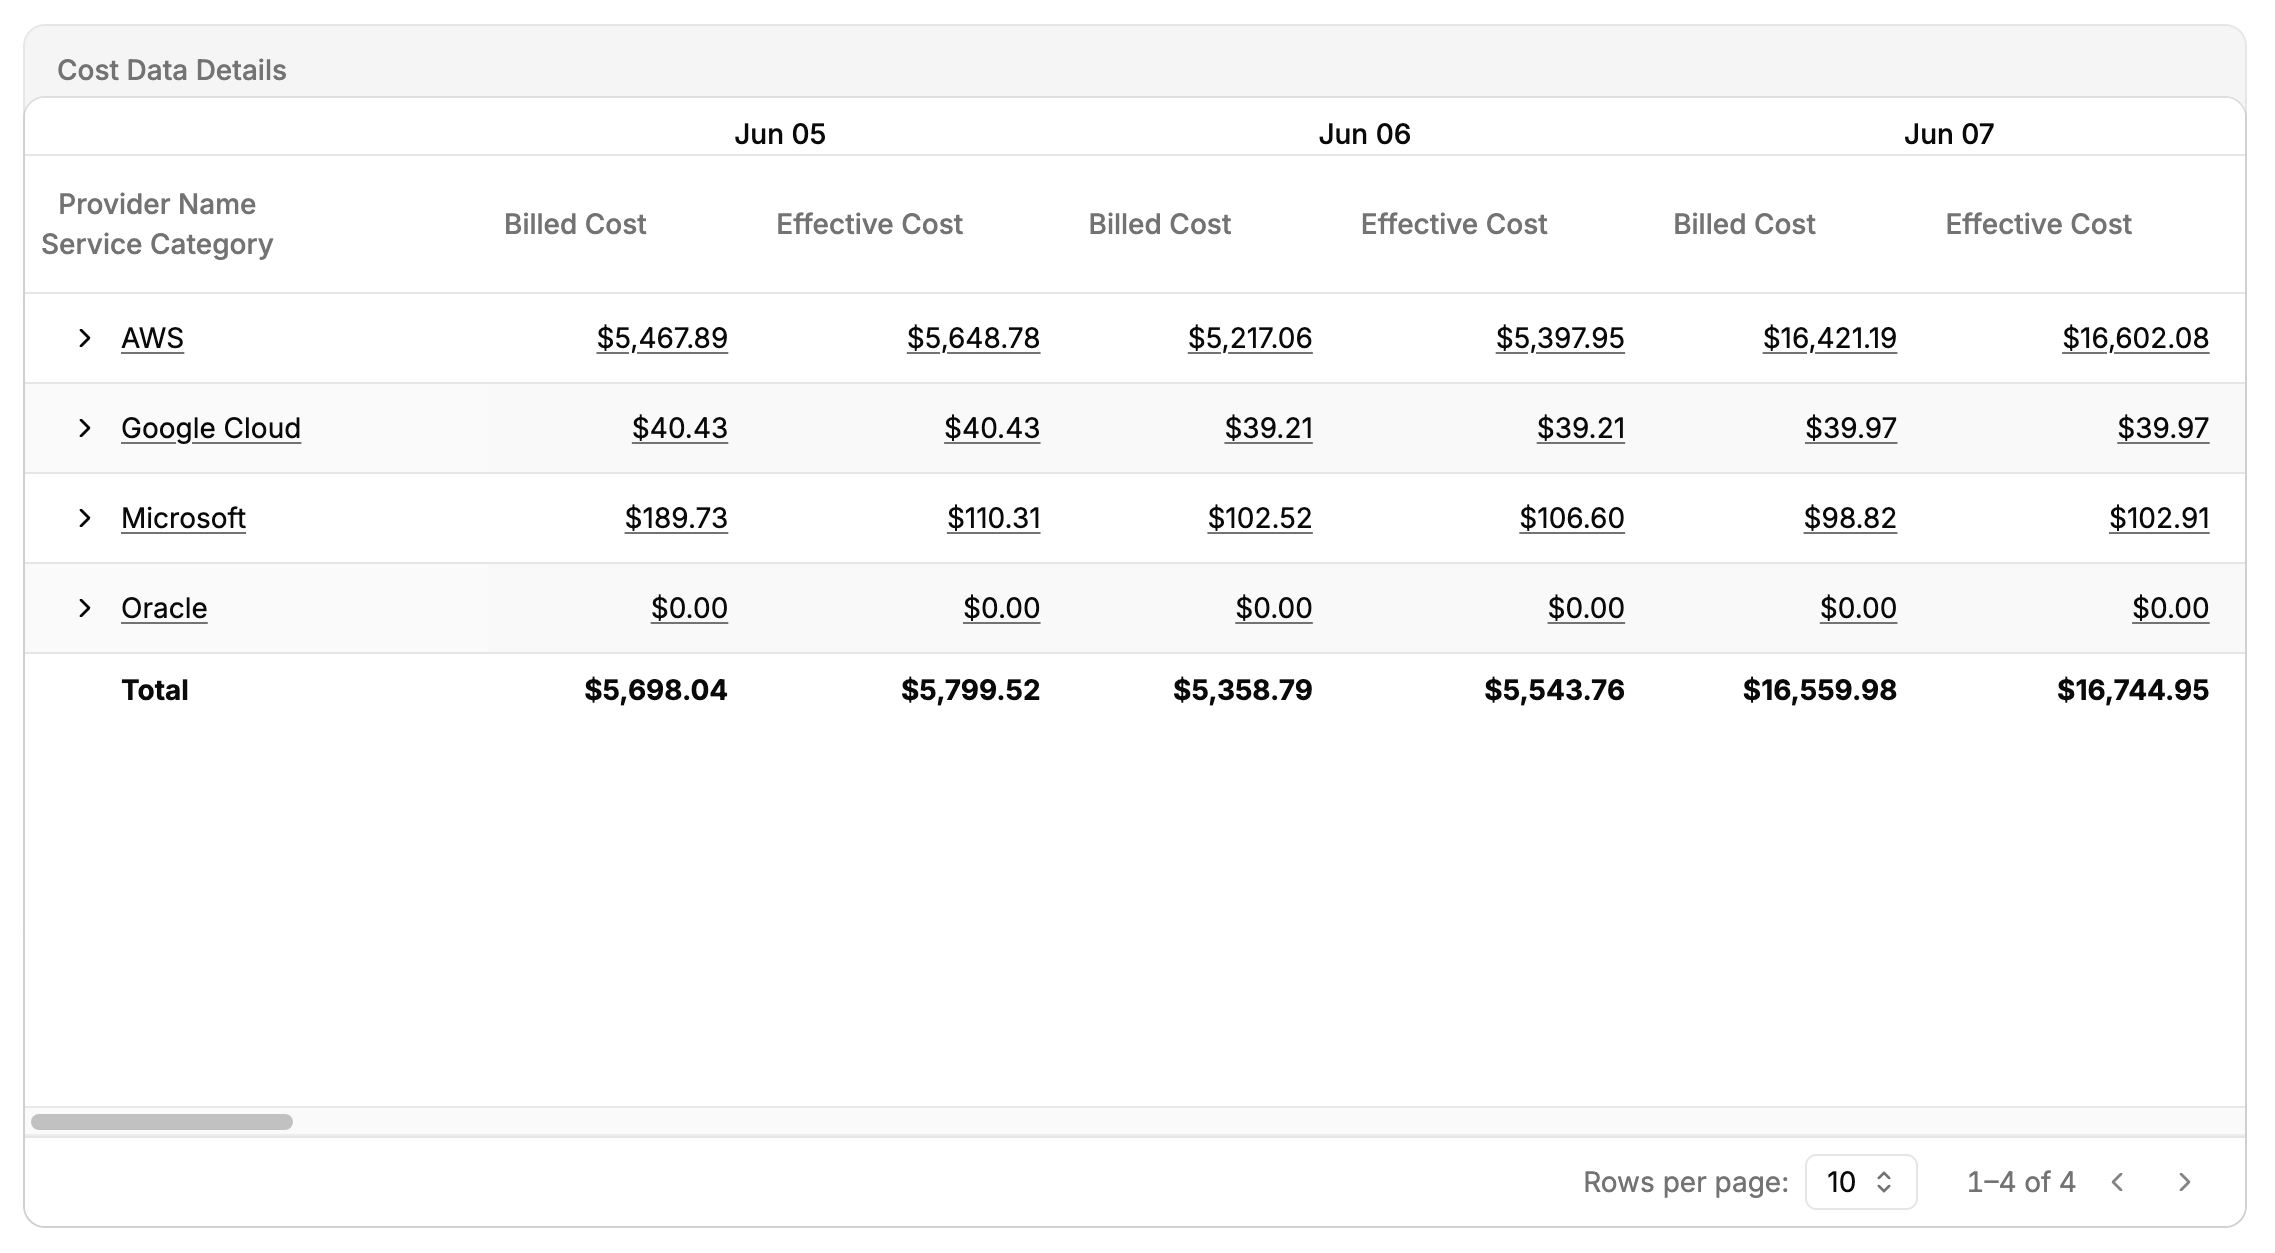 (opens full-size image in a new tab)
| Field | Description |
|---|---|
| Primary “Group By” | The primary cost data grouping. Determines the initial structure. |
| Secondary “Group By” | The secondary cost data grouping. Allows for more granular analysis. |
| Cost Metric Columns | Each column represents a metric that provides insight into costs for the date range. |
| Date Granularity | Date-based cost aggregation. Displays daily dates, week start, or month start. |
| Primary Grouping | Labels of primary grouping entities, providing the first level of cost segmentation. |
| Expand/Collapse Icon | Expand or collapse grouped data categories that contain secondary groupings. |
Customize cost report criteria
Adjust how insights are presented by modifying the Data Set, Group By, Date Range, Metrics, and additional Filters.
The report does not automatically update to reflect changes. Select Run at the bottom of the cost report criteria panel to refresh the report.
Access the cost report criteria panel
To access the cost report criteria panel:
- Select the filter icon in the upper-right corner of the Cost Explorer. This opens the Cost Report Criteria panel.
Choose a data set
The Cost Report Criteria panel opens with a Data Set section, a two-option toggle that determines which cost data the report is built from:
| Data Set | Description |
|---|---|
| Cloud billing (FOCUS) | Cloud provider billing data in the FOCUS format. |
| Kubernetes cost allocation | Kubernetes cost allocation data. |
The chosen data set determines which group by fields, metrics, and filters are available in the rest of the panel.
Switching data sets restages the report criteria, but nothing refetches until you select Run.
When Kubernetes cost allocation is selected, the available group-by fields, filters, and metrics switch to Kubernetes dimensions: Cluster, Namespace, Workload, Container, Pod, and Node, plus Kubernetes labels (for example, Namespace Label: team). A Cost Allocation filter section also appears with a Distribute idle & overhead costs toggle. Turning it on spreads idle and overhead capacity across your workload namespaces rather than showing it as a separate line item. See Kubernetes Report for more on how these costs are calculated.
Use “group by” to summarize costs
Grouping options help summarize costs effectively in both the Cost Explorer chart and the Cost Data Details table. A report supports a maximum of two group-by options: one primary and one optional secondary.
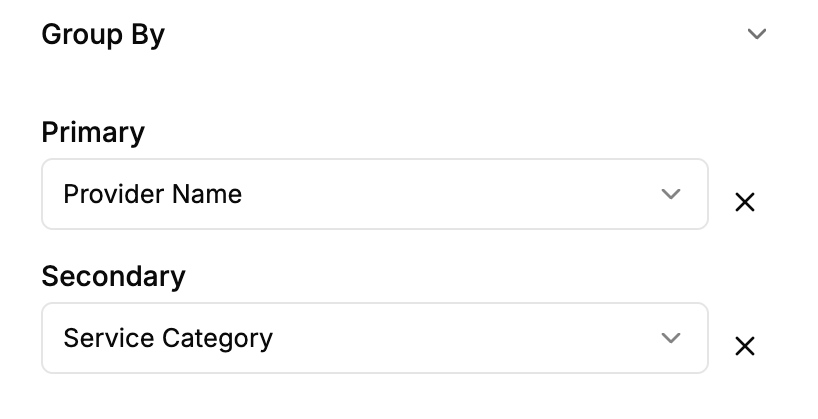 (opens full-size image in a new tab)
Primary “group by” option
- Determines the primary level of cost categorization.
- Selection results in separate stacked segments within each bar of the Cost Explorer chart.
- In the Cost Data Details table, each top row initially summarizes costs by the primary grouping.
Secondary “group by” option
- Optional. Select Add Secondary Group By to add it.
- Provides further classification when expanding a primary group.
- In the Cost Data Details table, expanding a row using the expand icon reveals cost breakdowns by the secondary “Group By” option.
Tags and Virtual Tags are selectable group-by options. Selecting either adds a tag-key picker for choosing the specific key to group by.
“Group by” option descriptions
| “Group by” option | Description |
|---|---|
| Billing Account ID | The unique identifier assigned to a billing account for cost tracking. |
| Billing Account Name | The name associated with the billing account. |
| Billing Account Type | The type of billing account (for example, enterprise, pay-as-you-go). |
| Billing Currency | The billing charge currency for resources or services. |
| Billing Period End | The end date of the billing period for the reported costs. |
| Billing Period Start | The start date of the billing period for the reported costs. |
| Charge Category | Whether the row represents an upfront or recurring fee, cost of previous usage, an after-the-fact adjustment (for example, credits), or taxes. |
| Charge Class | Whether the row represents a regular charge or a correction to one or more previous charges. Commonly used to differentiate refunds from regular charges. |
| Charge Description | The high-level context of the specific charge. |
| Charge Frequency | Specifies how often a charge occurs (for example, hourly, daily, monthly). |
| Charge Period End | The exclusive end date and time of a charge period. |
| Charge Period Start | The inclusive start date and time within a charge period. |
| Commitment Discount Category | Whether the discount identified in the Commitment Discount ID column is based on usage quantity or cost. |
| Commitment Discount ID | The unique identifier for a commitment-based discount. |
| Commitment Discount Name | The display name for a commitment-based discount. |
| Commitment Discount Status | Whether the charge corresponds with the consumption of the commitment-based discount identified in the Commitment Discount ID column or the unused portion of the committed amount. |
| Commitment Discount Type | A provider-assigned name to identify the type of commitment-based discount applied to the row. |
| Consumed Unit | Provider-specified measurement unit indicating how a provider measures resource or service stocking keeping unit (SKU) usage. |
| Contracted Unit Price | The agreed unit price for a single Pricing Unit of the associated SKU, inclusive of negotiated discounts, if present, while excluding negotiated commitment-based discounts or any other discounts. |
| Invoice Issuer Name | The name of the entity responsible for invoicing for the resources or services consumed. |
| List Unit Price | Suggested provider-published unit price for a single Pricing Unit of the associated SKU, exclusive of any discounts. |
| Pricing Category | Describes the pricing model used for a charge at the time of use or purchase. |
| Pricing Unit | Provider-specified measurement unit for determining unit prices, indicating how the provider rates measured usage and purchase quantities after applying pricing rules like block pricing. |
| Provider Name | Identifies the cloud service provider (for example, AWS, Azure, Google Cloud). |
| Publisher Name | Name of the entity that produced the purchased resources or services. |
| Region ID | Provider-assigned identifier for an isolated geographic area where a resource is provisioned or a service is provided. |
| Region Name | Name of an isolated geographic area where a resource is provisioned, or a service is provided. |
| Resource ID | Unique identifier assigned to a resource by the provider. |
| Resource Name | Display name assigned to a resource. |
| Resource Type | The kind of resource for which you are being charged. |
| Service Category | Highest-level classification of a service based on the core function of the service. |
| Service Name | An offering that can be purchased from a provider (for example, cloud virtual machine, SaaS database, professional services from a systems integrator). |
| SKU ID | Unique identifier for a provider-supported construct for organizing properties common across one or more SKUs. |
| SKU Price ID | Unique identifier for the unit price used to calculate the charge. |
| Sub Account ID | Unique identifier for a grouping of resources or services, often used to manage access and/or cost. |
| Sub Account Name | Name assigned to a grouping of resources or services, often used to manage access and/or cost. |
| Tags | Groups costs by the values of a selected tag key. Selecting this option adds a tag-key picker. |
| Virtual Tags | Groups costs by the values of a selected virtual tag key. Selecting this option adds a tag-key picker. |
Use metrics to customize the cost report data
Select which cost metrics are displayed in your cost report. This determines the numerical values visualized in the Cost Explorer chart and listed in the Cost Data Details table. Choose one or more metrics to compare cost perspectives.
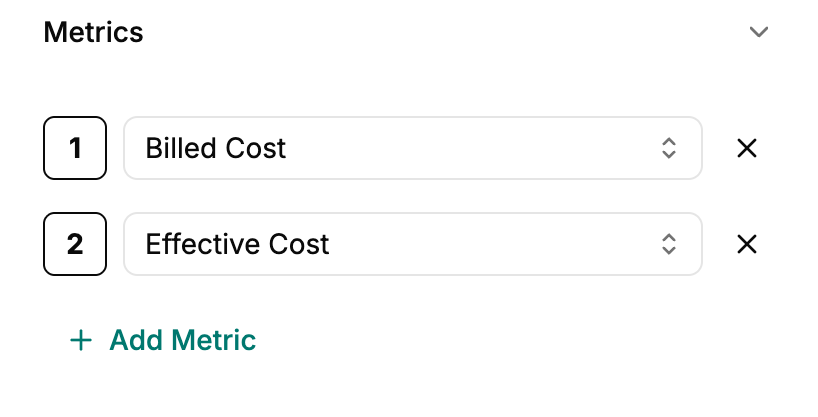 (opens full-size image in a new tab)
Set metrics for the report
- In the cost report criteria panel, locate the Metrics section. By default, two metrics are already selected (Billed Cost and Effective Cost).
- To modify the selected metrics:
- Use the first drop-down box to select the primary metric.
- Use the second drop-down box to choose an additional metric.
- To compare more metrics:
- Select Add Metric.
- Select an additional metric from the drop-down menu.
For some tenants, the available metrics are restricted to List Cost only (list-cost-only). In that case, List Cost is the default metric.
Each metric:
- Appears as a separate bar in the Cost Explorer chart, displayed per the chosen granularity (daily, weekly, or monthly).
- Adds a corresponding column to the Cost Data Details table.
Common metrics
| Metric Name | Description |
|---|---|
| Billed Cost | A charge serving as the basis for invoicing, inclusive of all reduced rates and discounts while excluding the amortization of upfront charges (one-time or recurring). |
| Consumed Quantity | Volume of a given SKU associated with a resource or service used, based on the Consumed Unit. |
| Contracted Cost | Cost calculated by multiplying the contracted unit price by the corresponding Pricing Quantity. |
| Effective Cost | The amortized cost of the charge after applying all reduced rates, discounts, and the applicable portion of relevant, prepaid purchases (one-time or recurring) that covered this charge. |
| List Cost | Cost calculated by multiplying the List Unit Price by the corresponding Pricing Quantity. |
| Pricing Quantity | Volume of a given SKU associated with a resource or service used or purchased, based on the Pricing Unit. |
Configure the date range for cost report data
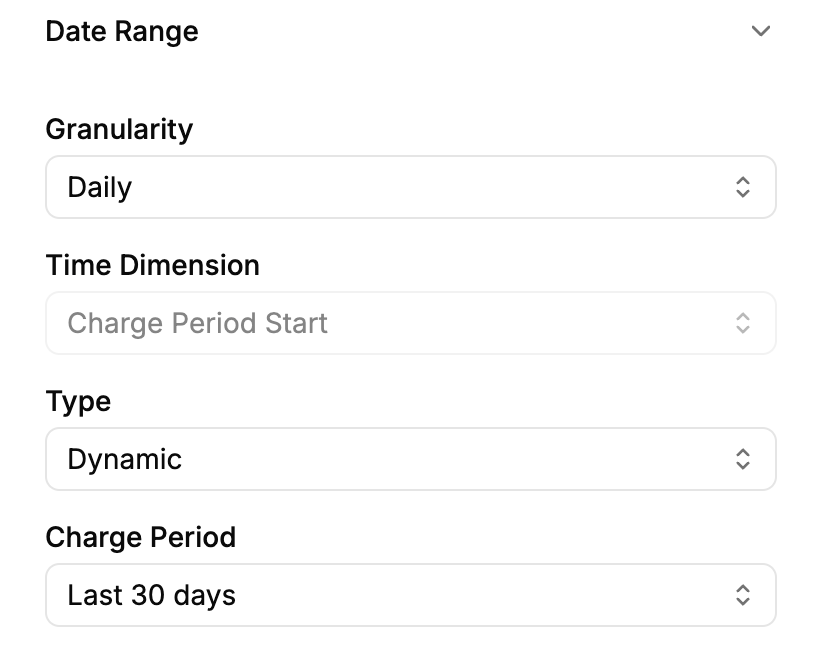
Define the time range and data resolution for your cost report using the Date Range settings. Two controls define the reporting period: Granularity and Type.
Choose between fixed custom dates or dynamic date options. Dynamic date ranges adjust reports automatically based on the current date.
 (opens full-size image in a new tab)
Configure granularity
- In the Date Range section of the cost report criteria panel, under Granularity, select between Daily, Weekly, and Monthly.
The available granularity levels are:
| Granularity | Description |
|---|---|
| Daily | Cost data for each day in the selected date range. Ideal for detailed tracking and daily usage analysis. |
| Weekly | Groups cost data by week, with each week starting on Monday. Useful for team-based reviews or weekly reporting. |
| Monthly | Groups cost data by calendar month, starting from the 1st of each month. Suitable for high-level reporting and monthly budget reviews. |
A read-only Time Dimension field shows which date field the report aggregates on: Charge Period Start for daily and weekly granularity, and Billing Period Start for monthly granularity.
Static and dynamic date ranges
Under Type, choose how the reporting period is defined:
- Static: A fixed reporting period defined by explicit dates.
- Dynamic: A rolling period that adjusts automatically based on the current date.
Configure a static date range
Static date ranges are ideal for fixed historical data.
- In the Date Range section of the cost report criteria panel, under Type, select Static.
- For Daily or Weekly granularity, use the calendar date-range picker to select the start and end dates of the reporting period.
- For Monthly granularity, use the Start Month and End Month pickers instead.
Configure a dynamic date range
Dynamic ranges are ideal for scheduled reviews, recurring financial analyses, and ongoing cost monitoring.
- In the Date Range section of the cost report criteria panel, under Type, select Dynamic.
- Select a preset. The available presets depend on the selected granularity:
| Granularity | Available presets |
|---|---|
| Daily or Weekly | Last 7 days, Last 30 days, Last 12 months, Month to Date, Quarter to Date, Year to Date |
| Monthly | Month to Date, Quarter to Date, Year to Date, Last month, Last 3 months, Last 6 months, Last 12 months |
Use filters to refine cost report data
Narrow down and target specific subsets of cost data based on a variety of attributes. Ensures your cost report reflects only the most relevant information, helping you focus analysis on relevant dimensions such as service type, region, billing account, and more.
Access the Filters section from the cost report criteria panel.
 (opens full-size image in a new tab)
Key functionalities
- Filter groups: Filters are built as one or more groups of conditions. Select Add Group to add a group, and use the root AND/OR toggle to control how the groups combine. Select Clear all filters to reset.
- Conditions: Each condition consists of a field, an operator, and a value.
- Multi-type filtering:
- Drop-down filters: For categorical fields (for example, Billing Account Name, Provider Name, Service Category), select one or more values from the drop-down menu.
- Range filters: For numerical fields (for example, Billed Cost, Consumed Quantity, List Unit Price), set a minimum and/or maximum value using the numeric input boxes.
- Tag filters: Tags and Virtual Tags are separate filter fields, each with a tag-key picker. Tag and label conditions use the contains and not contains operators.
- Type-to-search values: High-cardinality fields use a type-to-search value picker. The search runs server-side and requires a minimum of 2 characters.
FOCUS filters
The Filters section supports an extensive range of FOCUS filtering dimensions and metrics, enabling you to refine cost report data across financial, technical, and operational parameters. Below is a categorized breakdown of the available filters:
- Cost:
- Pricing:
- Billing and account:
- Charge type:
- Commitment discounts:
- Usage:
- Location:
- SKU:
- Resource:
- Service-level:
Additional filter controls
Additional controls that enhance the usability and flexibility of filtering:
| Control | Description |
|---|---|
| Filter count | A counter on the Cost Explorer’s filter icon displays the number of active filters. |
| Add Group | Adds a new filter group. Groups are combined according to the root AND/OR toggle. |
| Clear all filters | Clears all applied filters. This is useful when you want to reset the report view and start a fresh filtering configuration. |
| Remove | Next to each filter is a Remove button that removes the filter without affecting others. |
Run and save the report
Select Run at the bottom of the Cost Report Criteria panel to refresh the report with the current criteria. On desktop, the panel stays open beside the report after you run it, so you can keep adjusting the criteria.
To save the report:
- When editing a saved report you have edit rights to, a Save split button saves your changes in place. Its drop-down includes Save As for creating a copy.
- Otherwise, a single Save As button opens the Save Report As dialog to create a new saved report.
Next steps
- Review Kubernetes-specific spending in Kubernetes Report
- Create and manage reports in Saved Reports