Anomalies
3 minute read
Using predictive cost forecasting and statistical models, CloudBolt identifies cost outliers that may indicate issues such as misconfigurations, unplanned consumption, billing discrepancies, or security events.
By default, the page shows detected events from the past month.
Anomaly detection
CloudBolt determines anomalies using a combination of predictive forecasting and threshold-based evaluation. An anomaly is recorded when both of the following conditions are met:
- The billed cost for a given day exceeds the forecasted upper bound for that day.
- The billed cost also exceeds a minimum threshold of $10.
When these criteria are satisfied, CloudBolt classifies the event as an anomaly and displays it in the Anomalies interface. This approach helps minimize false positives while ensuring that cost irregularities are quickly brought to your attention.
Access the Anomalies page
- Log in to the CloudBolt Platform.
- From the sidebar, select Anomalies.
Anomalies overview
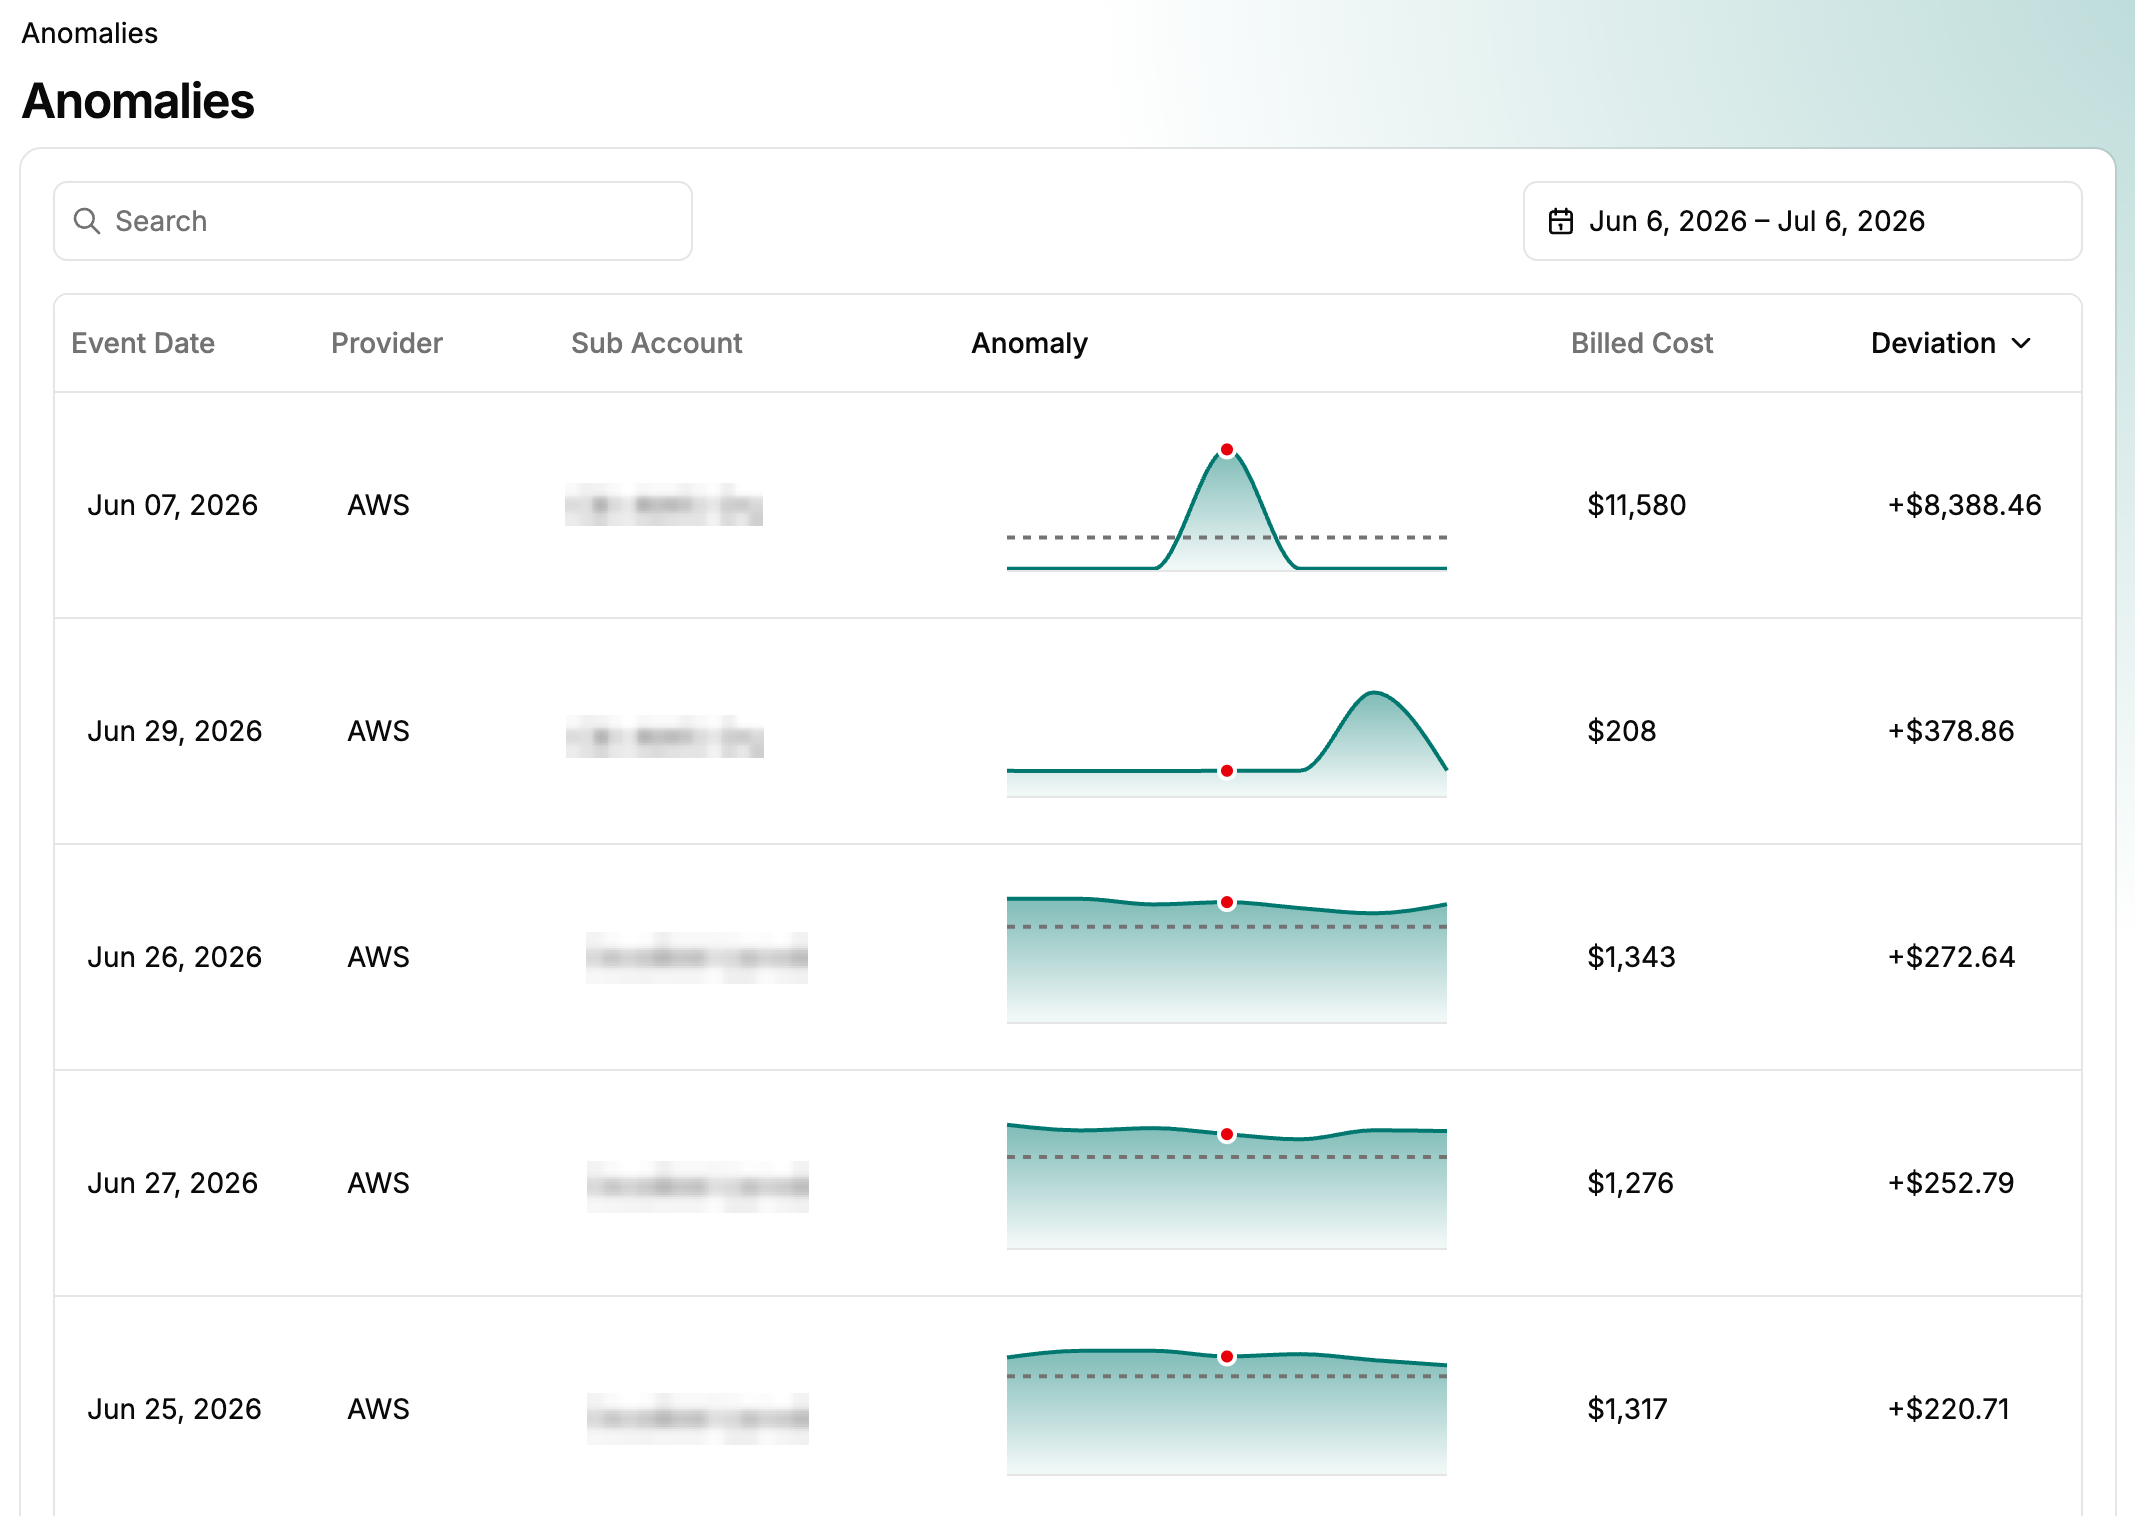
Detected anomalies are listed in a table.
 (opens full-size image in a new tab)
The table includes the following columns:
| Column | Description |
|---|---|
| Event Date | The anomaly event date. |
| Provider | The cloud infrastructure service provider where the anomaly was detected. Refer to FOCUS standard: Provider for details. |
| Sub Account | The cloud account where the anomaly was detected. Refer to FOCUS standard: Sub Account Name for details. |
| Anomaly | An inline graph displaying daily billed costs for ±3 days around the anomaly. Hovering over any point on the graph reveals a tooltip with the billed cost. A dotted line marks the forecasted upper bound. |
| Billed Cost | The actual cost billed for the anomaly date. |
| Deviation | The numeric difference between the billed cost and the forecasted upper bound. |
| Expected Range | The forecasted cost range for the date. |
| Investigate | The Investigate button opens a cost report for the anomaly date, spanning ±3 days. |
Sorting and filtering
- Column sorting: Select a column header to sort in ascending or descending order. A directional arrow indicates the sort order.
- Filter: Use the Search text box to filter the anomalies by Provider or Sub Account.
Pagination and display controls
- By default, the table shows 10 anomalies per page.
- Use the Rows per page dropdown menu to change the number of rows displayed.
- Pagination controls are at the bottom of the table, along with an anomaly count.
Change the anomaly detection date range
- Select the Select date range control above the table.
- Choose the start and end dates in the calendar. The table refreshes when the picker closes.
Investigate an anomaly in detail
Each anomaly row includes an Investigate button to explore the anomaly in a cost report view. Selecting Investigate displays:
- A custom report for the anomaly, showing cost data grouped by Service Name to help identify which service(s) contributed most to the anomaly.
- The report is filtered to the Provider and Sub Account, and a date range of 3 days before and after the anomaly.
Customize the report further by:
- Adding a secondary “Group By” option
- Modifying date ranges
- Applying additional filters
This is a temporary report for exploratory purposes and cannot be saved.