# Reports
> Reports turn Cloud Management Platform (CMP) data into tables and charts you can filter, sort, and export
---
Site [llms.txt](/llms.txt)
---
Select **Reports** in the navigation bar to open the Reports page. Results are scoped to the groups and environments you have permission to see.
## Who can see the Reports page
The **Reports** link appears in the navigation bar for:
- Super Admins.
- Users with the Global Viewer global role.
- Everyone else, when the **Show "Reports" in navigation bar for all Users** setting is enabled in the **UI** tab of **Admin** > **Miscellaneous Settings**. This setting is disabled by default.
Users who do not qualify cannot reach report URLs directly.
The following reports are always limited to Super Admins and Global Viewers: **Group Costs**, **Global Allocation Trends**, and **Servers by Environment**.
### Hide a built-in report
To remove a built-in report from the page for everyone, go to **Admin** > **Miscellaneous Settings**, open the **UI** tab, select to edit the **Settings** panel, choose it from the **Disabled Reports** dropdown, and select **Save**. Disabled reports are also blocked by URL.
## Built-in reports
Each report is a card, grouped under a heading for its category. Selecting a card runs the report. There are four built-in categories, plus a Custom category visible when a UI extension adds a report.
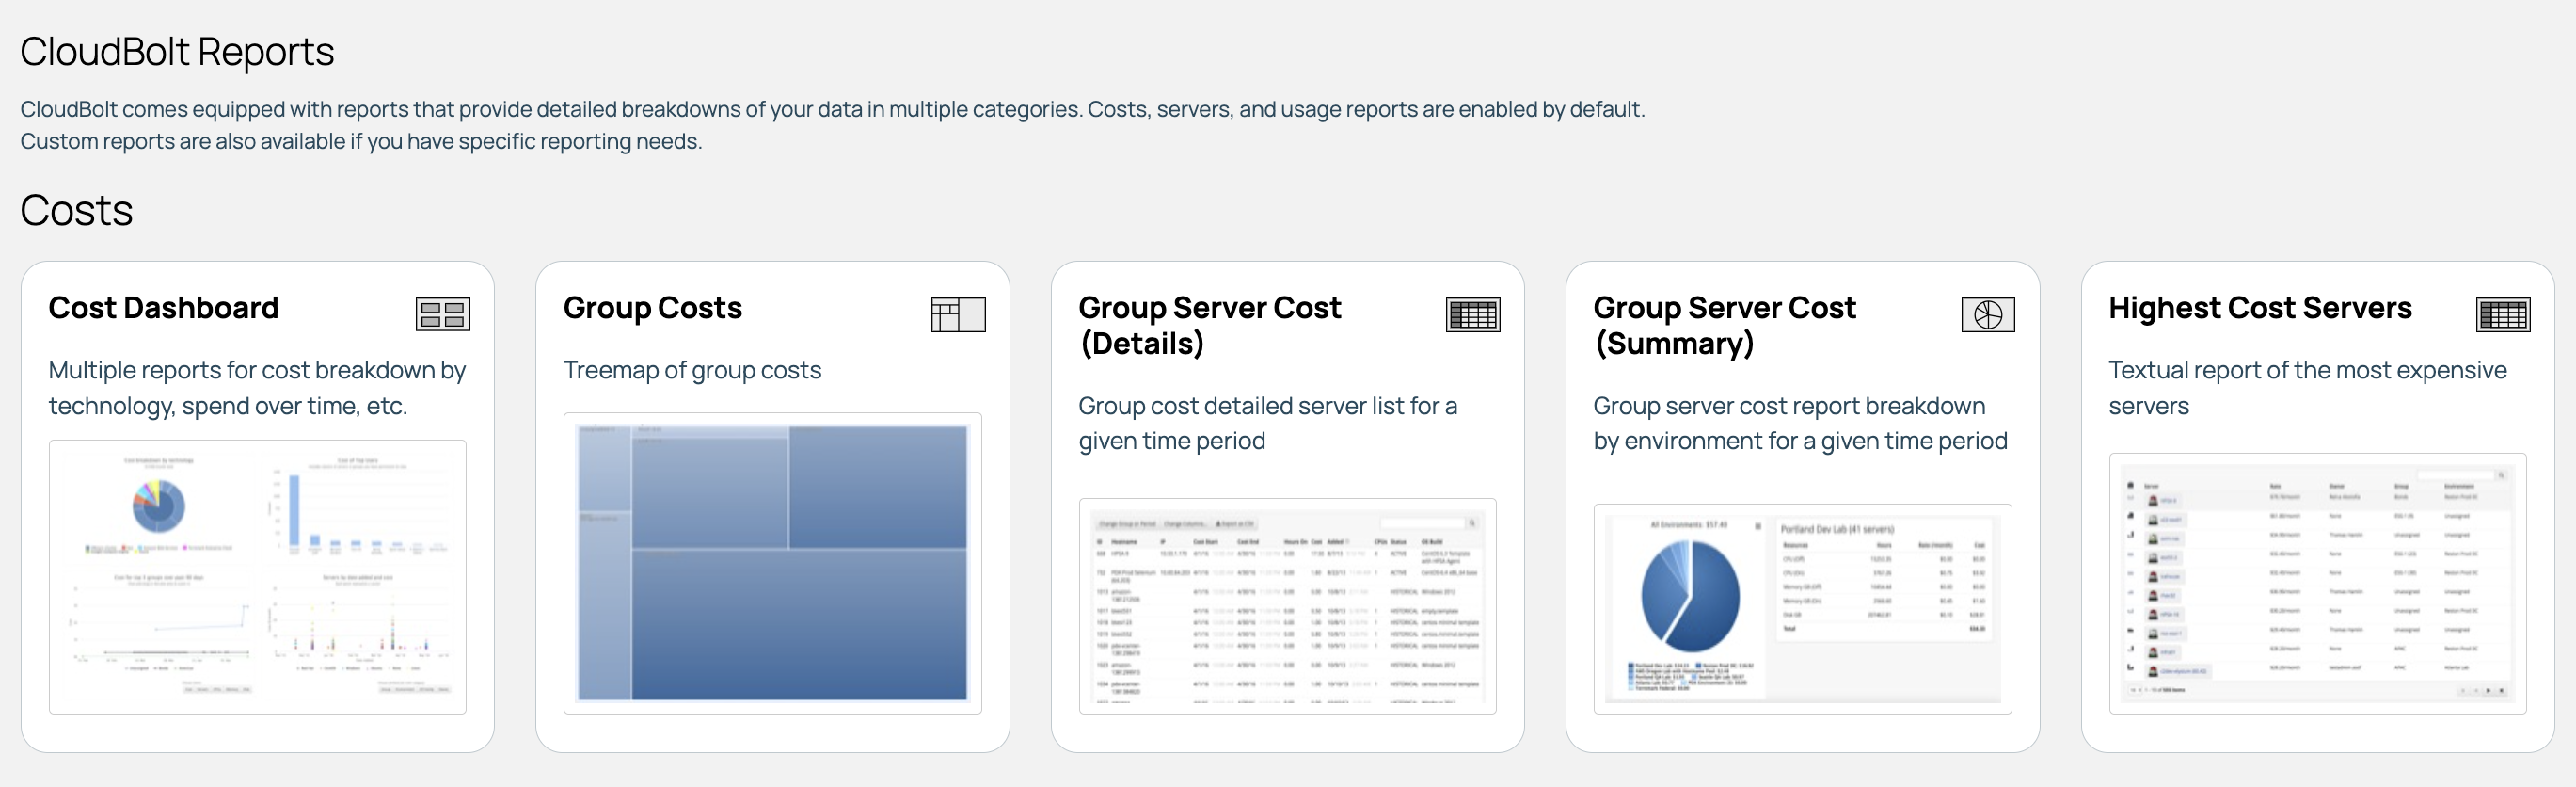
### Costs
Cost reports read the rates CMP has calculated for your servers and resources. See [Rates](/docs/cmp/configure/order-forms-and-pricing/rates/).
| Report | What it shows |
| --- | --- |
| **Cost Dashboard** | Server cost broken down by resource technology; costs of your top users; group cost over time; and servers plotted by date added against cost. Covers active servers and resources only. |
| **Group Costs** | Treemap that sizes each group by its cost, starting from the top-level groups. Super Admins and Global Viewers only. |
| **Group Server Cost (Details)** | Server-by-server cost list for a group over a date range. A dialog asks for both before the report runs. |
| **Group Server Cost (Summary)** | Group Server Cost report broken down by environment, with a chart and a tab per environment. Can be emailed. |
| **Highest Cost Servers** | Table of your most expensive servers. |
| **Savings from Power Schedules** | Cost saved by powering servers off on a schedule, summarized by resource technology for a date range and an optional set of groups. Super Admins and Global Viewers only. The card disappears if the **Auto-power control servers** recurring job is deleted. See [Schedule power on/off](/docs/cmp/use/orchestration/power-schedules/). |
### Resources
| Report | What it shows |
| --- | --- |
| **Custom Resource Report** | Table of resources matching chosen filters and showing chosen columns. See [Custom reports](/docs/cmp/use/reports/#custom-reports). |
### Servers
| Report | What it shows |
| --- | --- |
| **Custom Server Report** | Table of servers matching chosen filters and showing chosen columns. See [Custom reports](/docs/cmp/use/reports/#custom-reports). |
| **Global Allocation Trends** | Line chart of one metric over time across every group. Switch between **Servers**, **CPUs**, **Memory**, **Disk**, and **Rate**, and drag across the plot to zoom. Super Admins and Global Viewers only. |
| **Interactive Servers Report** | Bar chart of aggregate statistics with a server table beneath it, both filtered by group, environment, and OS family. |
| **Recent Servers** | Table of recently added servers. |
| **Servers by Environment** | Bar chart of how many servers each environment owns. Super Admins and Global Viewers only. |
| **Servers by Group** | Bar chart of how many servers each group owns. |
| **Servers by OS** | Pie chart showing the number of servers per OS family. |
| **Servers by Owner** | Bar chart of the users who own the most servers. |
### Usage
The two utilization reports are empty unless the **Refresh All Server Utilization** recurring job, which ships disabled, is enabled. See [Built-in recurring jobs](/docs/cmp/use/orchestration/recurring-jobs/built-in/).
| Report | What it shows |
| --- | --- |
| **Server Trends for Top Groups** | Line chart of active server counts over the past 90 days for the five groups that hold the most servers. |
| **Server Utilization Graph** | Bar graph of average utilization across your active servers. |
| **Server Utilization Table** | Per-server averages for CPU and memory (as a percentage of capacity), disk I/O, and network throughput. Switch the averaging period between **Year**, **Month**, **Week**, **Day**, and **Hour**; defaults to Month. |
| **Storage Report** | Table and bar chart ranking servers by storage used. |
## Custom reports
**Custom Server Report** and **Custom Resource Report** allow you to build your own view of the data. Super Admins can share saved definitions.
### Run a custom report
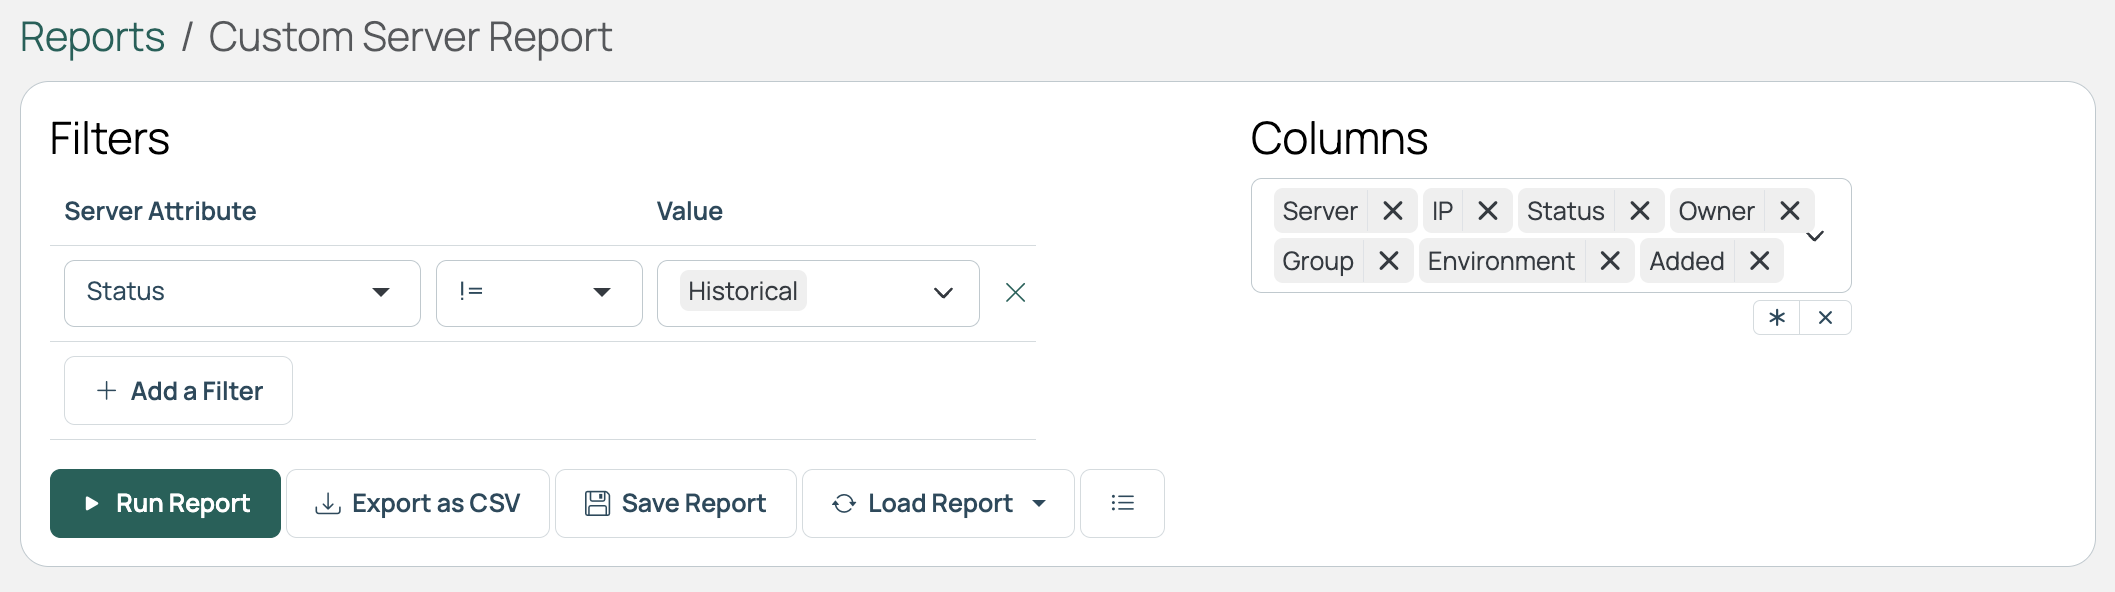
1. Select **Reports** in the navigation bar, then select **Custom Server Report** or **Custom Resource Report**.
1. Build a filter row: choose an attribute, a comparison, and one or more values. Each report opens with a filter that excludes historical records.
1. To filter on more than one attribute, select **Add a Filter** and fill in the new row. Filters combine with AND, so a server or resource must match every row.
1. Choose the **Columns** to show. The list includes the report's standard columns plus every parameter and custom field; **About these options** describes them. Use the asterisk to select all columns, or the X to clear the selection.
1. Select **Run Report**. Results appear below, sortable and searchable, with a **Change Columns** button to adjust columns without rebuilding the filter.
Both reports offer the following fixed set of attributes to filter on, as well as every parameter and custom field in your install:
| Report | Built-in filter attributes |
| --- | --- |
| **Custom Server Report** | `Added`, `Environment`, `Group`, `Hostname`, `IP`, `Owner`, `Rate`, `Resource Handler`, `Resource Technology`, `Status` |
| **Custom Resource Report** | `Blueprint`, `Created Date`, `Group`, `Name`, `Owner`, `Rate`, `Resource Type`, `Status` |
### Save, reuse, and share a custom report
A saved custom report stores the filters and columns, not results.
| Control | What it does |
| --- | --- |
| **Save Report** | Saves the filters and columns currently on screen. CMP builds the name from your first name or username, in the form `'s custom server report`, and adds a number if that name is taken. Rename it from the saved reports page. |
| **Load Report** | Lists the saved reports you own or that have been shared with you. Choosing one loads its filters and columns and runs it. |
| **Update Report** | Appears once you have loaded a saved report. Overwrites the report with the filters and columns now on screen. |
| **Save New Report** | Appears once you have loaded a saved report. Keeps the original and saves your changes as a new saved report. |
| List icon | Opens **Your Saved Custom Reports**, which lists every saved report you own or can see, with its type, filters, columns, owner, and creation date. |
#### Rename or delete a saved report
On **Your Saved Custom Reports**, the pencil icon in a row renames the report, and the X deletes it. You can rename or delete shared reports unless a Super Admin owns them. Super Admins can act on any saved report.
#### Share a saved report
Restricted to Super Admins.
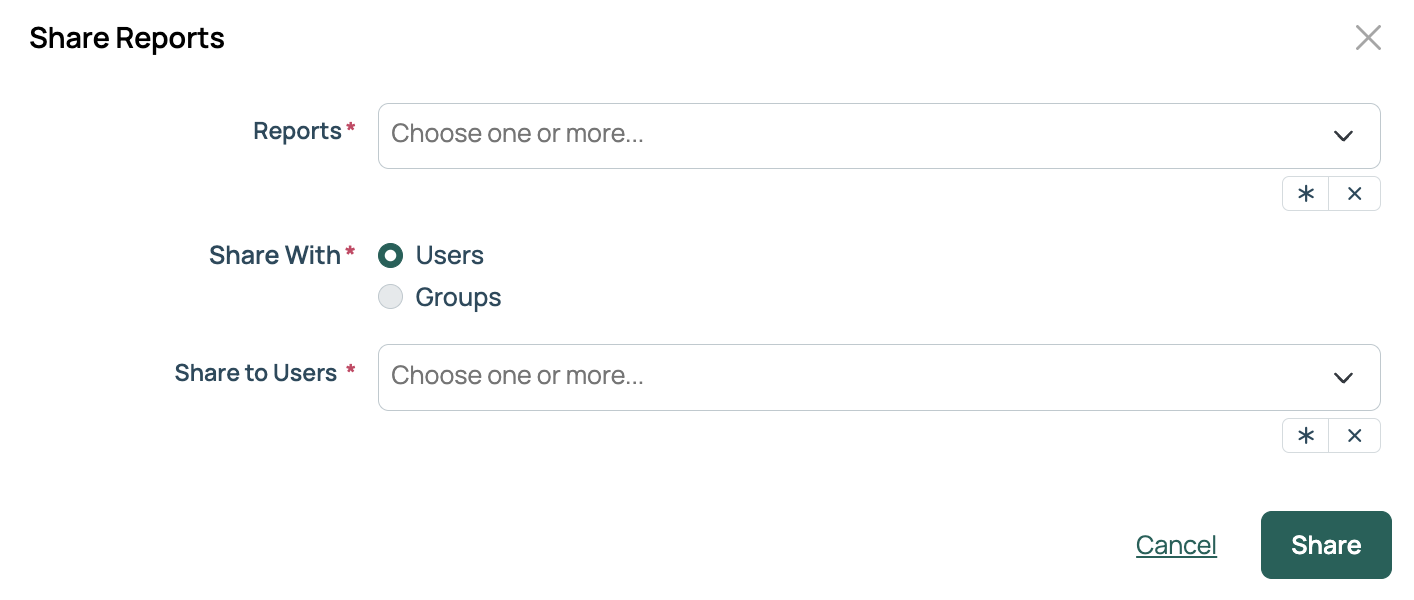
1. On **Your Saved Custom Reports**, select **Share Report**.
1. Under **Reports**, select one or more of the reports you own.
1. Set **Share With** to **Users** or **Groups**, then pick the recipients.
1. Select **Share**.
## Export or email results
Custom reports have an **Export as CSV** button next to **Run Report**. Other reports that support export have one at the top of the page, and some charts offer a CSV download from the chart menu.
**Group Server Cost (Summary)** is the only report you can email. On the results page, select **Email Report**, enter a comma-separated list of addresses, and select **Send Email**.
## Add your own reports
A UI extension can register its own report, which then appears on the Reports page under the **Custom** category alongside the built-in ones. See [UI elements that support extensions](/docs/cmp/developer-resources/ui-extensions/supported-elements/).
## Related
- [Dashboard](/docs/cmp/get-started/dashboard/): the landing page with charts and activity feed.
- [Miscellaneous settings](/docs/cmp/configure/administration/system/miscellaneous-settings/): where the report settings live.
- [Rates](/docs/cmp/configure/order-forms-and-pricing/rates/): how CMP calculates server and resource costs.
- [Built-in recurring jobs](/docs/cmp/use/orchestration/recurring-jobs/built-in/): including **Refresh All Server Utilization**.
- [UI extensions](/docs/cmp/developer-resources/ui-extensions/): how to build and install an extension that adds a report.