# Dashboard
> Learn about the features of the Dashboard
---
Site [llms.txt](/llms.txt)
---
The Dashboard provides teams with comprehensive visibility into cloud spend. Constructed on real-time data pipelines, the Dashboard delivers:
- **Holistic Cost Visibility:** Aggregation of actual and forecasted spend across multiple cloud providers, segmented by service and environment.
- **Trend Analysis & Forecasting:** Interactive visualizations depicting historical spending patterns, with embedded models projecting end-of-period costs to inform budget planning.
- **Customizable Controls:** Flexible filters, time-range selectors, and account-level credentials that ensure stakeholders view data tailored to their permissions.
## Access the dashboard
1. Log in to the CloudBolt Platform. The Dashboard displays upon login.
1. To go to the Dashboard from elsewhere, select the **Dashboard** icon in the sidebar.
## Dashboard overview
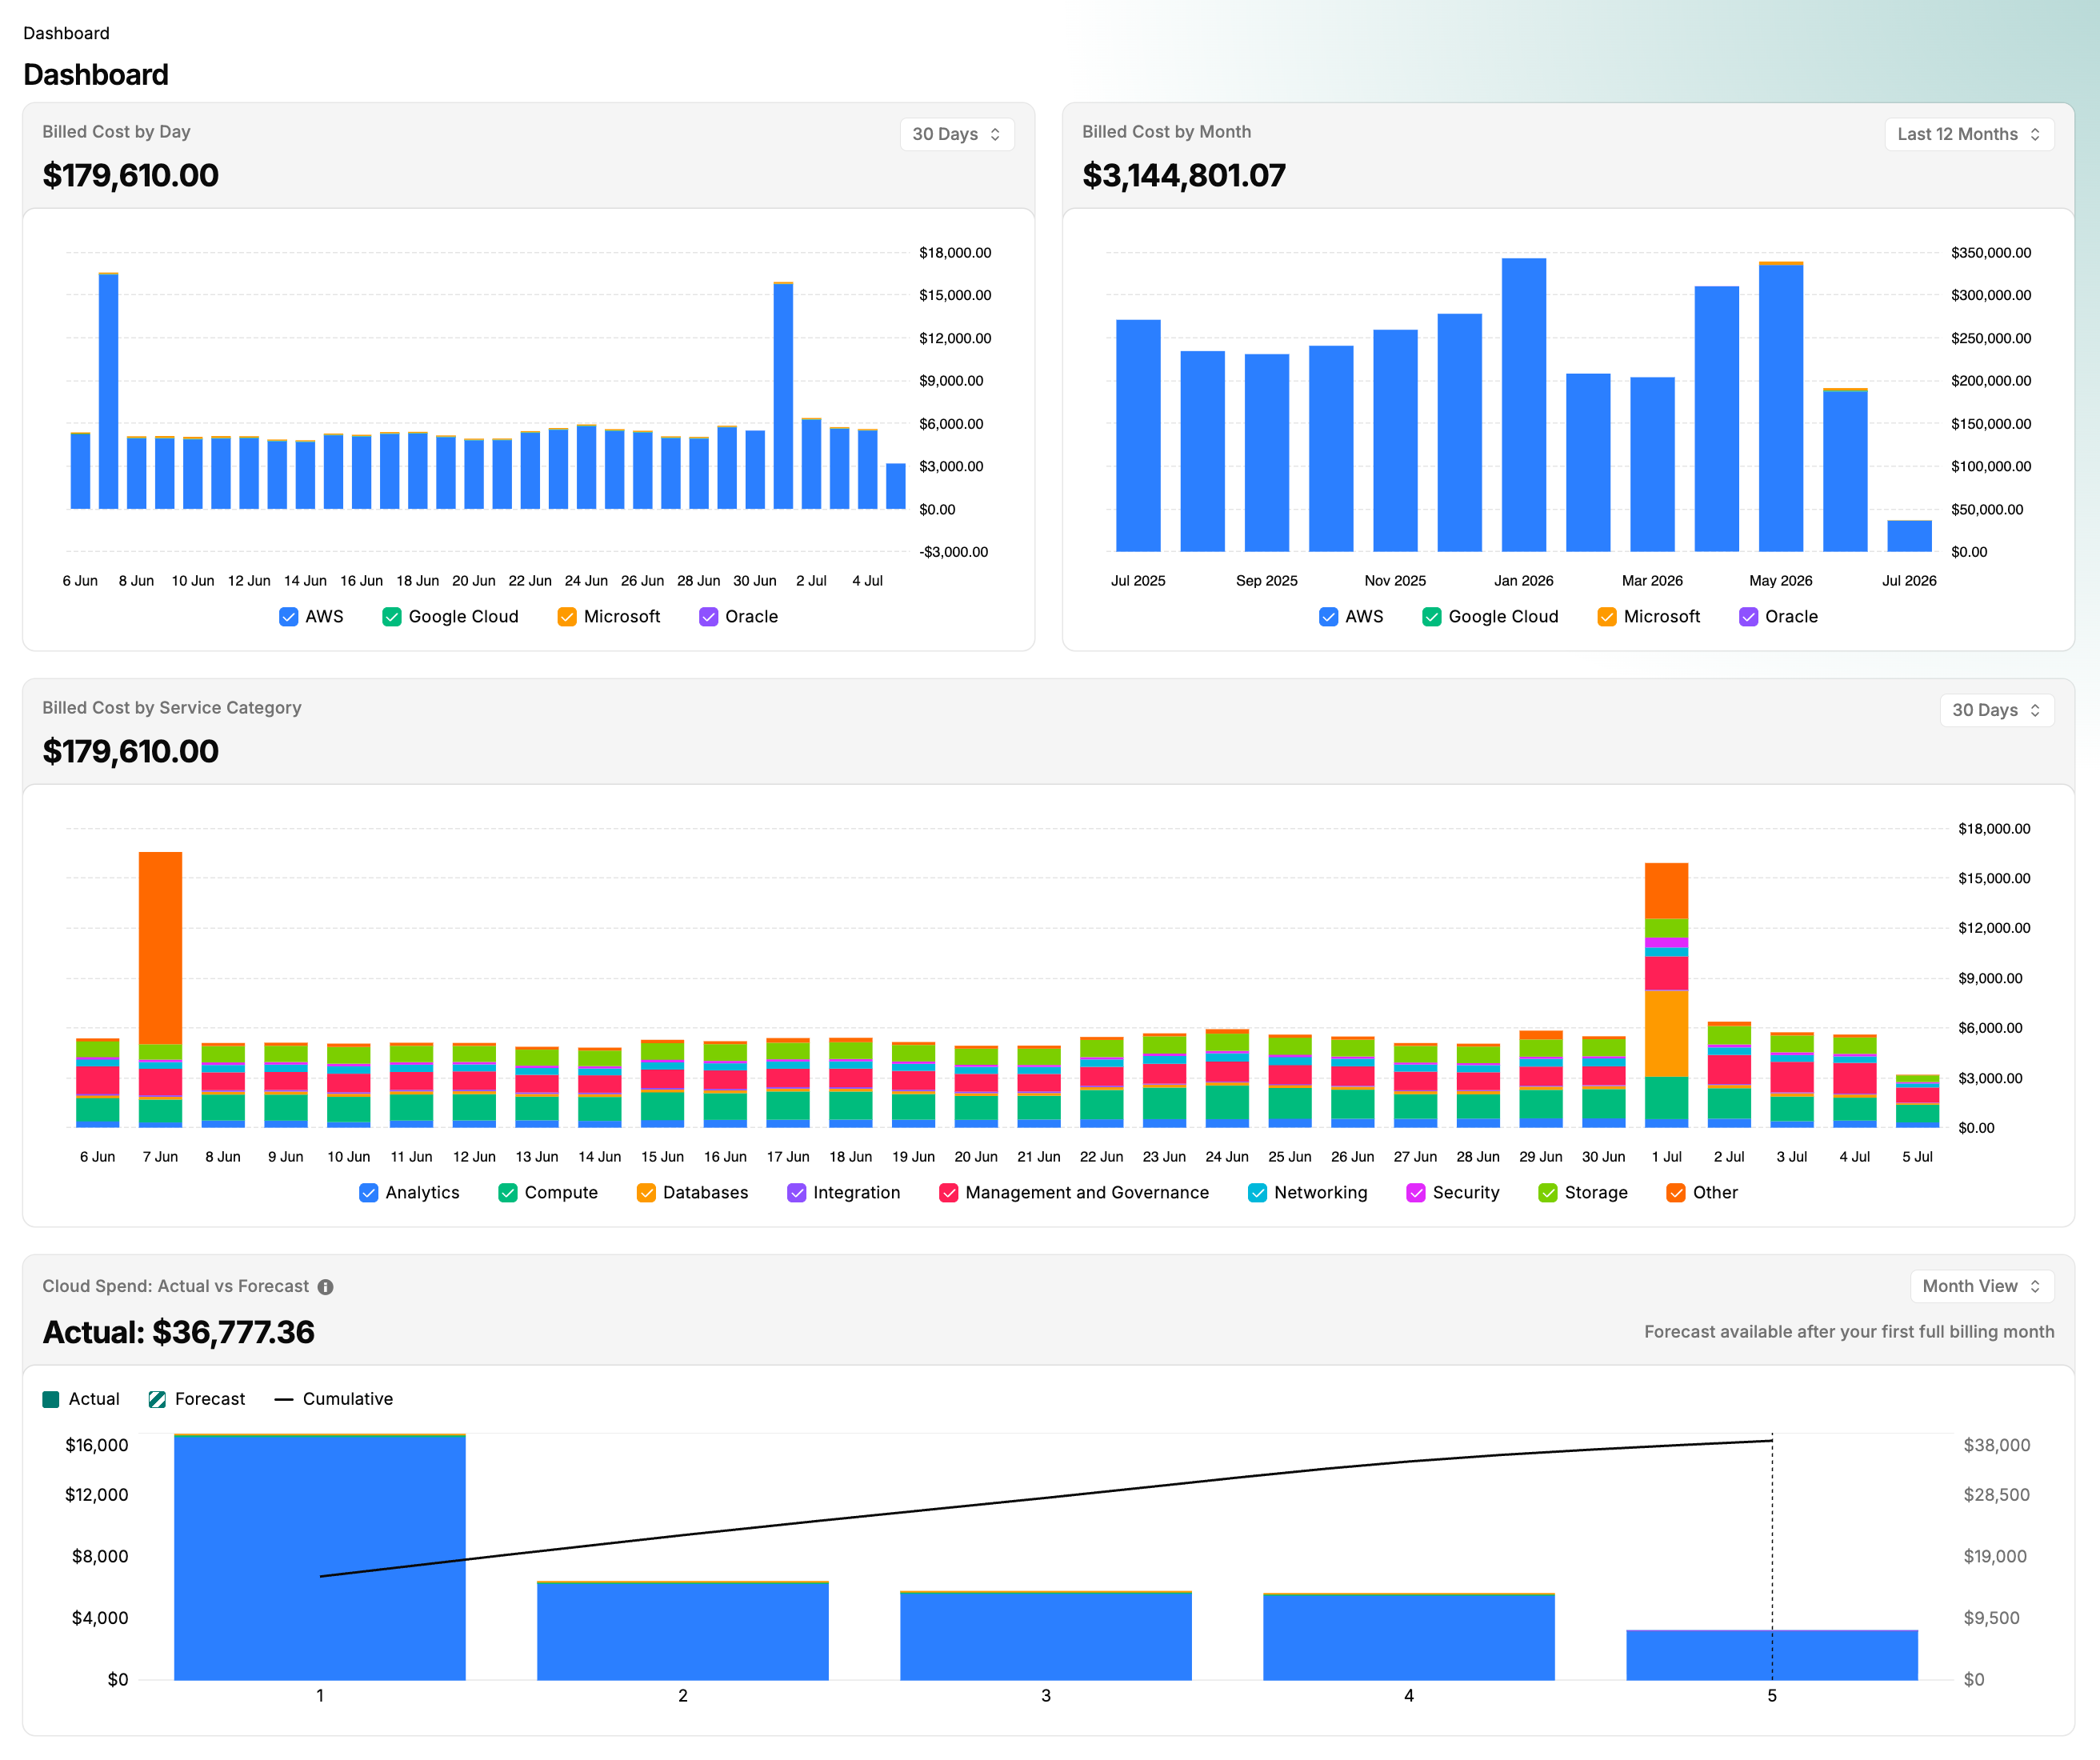
| Section | Description |
| --- | --- |
| Billed Cost by Day | Displays daily cloud costs for the past 30 days.
- Use the dropdown to see the 60- or 90-day view.
- Select or deselect configured clouds to customize the display.
- Hover over a bar to see detailed cost information for a specific day. |
| Billed Cost by Month | Displays monthly cloud cost for the past 12 months.
- Use the dropdown to view the last 6 months.
- Select or deselect configured clouds to customize the display.
- Hover over a bar to see detailed cost information for a specific month. |
| Billed Cost by Service Category | Displays daily costs by service category for the past 30 days.
- Use the dropdown to see the 60- or 90-day view.
- Select or deselect service categories to customize the display.
- Hover over a bar to see detailed cost information for a specific day. |
| Cloud Spend: Actual vs Forecast | Compares actual cloud spend to forecasted spend for the current month.
- Use the dropdown to see the quarterly view.
- Hover over a bar to see detailed spend information for a specific day or week, depending on the selected view. |
## About these figures
- **Cost metric:** The Dashboard charts show **Billed Cost**, the invoiced charge including discounts but excluding amortized upfront purchases. Some accounts display **List Cost** instead; the chart titles show which metric is in use. For metric definitions, see [Cost Explorer](/docs/cbp/navigating-the-platform/cost-explorer/#common-metrics).
- **Data through date:** The date beneath the page title is the most recent day included in the charts. If processing is running behind, an earlier date is shown with a warning indicator.
- **Currency:** Amounts are shown in the currency selected under **Currency** in the account menu. Select **Source currency** to show amounts in the currency they were billed in.